WHY SHOULD CROSS COUNTRY COURSES
BE MEASURED ACCURATELY ?
John Tucker
Men’s Cross Country
Washington and Lee University
We’ve all been there......taking times as our runners cross the finish line, then soon notice all of them are significantly faster or slower than expected. After a few minutes of either false elation over new “ PR’s” or sincere commiserations over how tough the course ran, we realize that old problem with cross country has surfaced again. Obviously, the course was longer or shorter than thought making it impossible for our athletes to know how well they raced.
If you coach or run cross country, you will probably agree this is the greatest sport on earth. The thrill of racing over hills and through woods and fields is unmatched in athletics. The type of individual that becomes an endurance athlete, the things we learn from pushing our limits, the variety and beauty of unforgettable courses, make running and coaching cross country a true privilege. But this great sport has an old problem, knowing just how well a runner performs. Unlike track, where every “course” is identical and performances are universally comparable, cross country is a sport where until recently you couldn’t know exactly how competitively an athlete runs, beyond their place verses familiar runners, much less be able to compare performances on very different courses. The uniqueness of each course is one of the reasons we love cross country but also one of the reasons why race results tell you so little.
The other reason it is so difficult to make sense of meet results is the inaccurate and inconsistent measurement of courses. To illustrate, it takes a runner 8 seconds to travel 40 meters at 5:22/mile pace. So for many cross country athletes an 80 meter course length discrepancy could cause a finish time to look 20 seconds slower or faster than it should. But as you will read below, through no lack of diligence by our dedicated coaches, many courses have been inaccurately measured by as much as 100 meters, making race results almost meaningless beyond finish order. Attempting to compare results from such courses would make even less sense.
Some might argue that attempting to meet these challenges is a waste of time. “It’s cross country”, they say, perhaps suggesting they are part of a tradition or that there simply is no way to know how competitively a cross country athlete performs, like we can in track. Until recently they would be right. However, as technology evolves it is not surprising that several systems are already in operation or being developed[1] which factor course difficulty so runners and coaches can objectively compare performances on different courses. Inevitably one or more of these systems will become utilized on a wide scale. When that happens course difficulty ratings will be a regular component of race results. Comparing cross country performances will be commonplace and targeting correct training and race paces for runners on any course will become as familiar as target splits on tracks. But one essential component of any such future cross country world will be accurate course measurements.
In the summer of 2006, researchers from Washington and Lee University, working to develop a course difficulty rating system[2], tested the accuracy of the device used to measure virtually every cross country course in the U.S. to find out why so many have significant length discrepancies, some in excess of 100 meters.

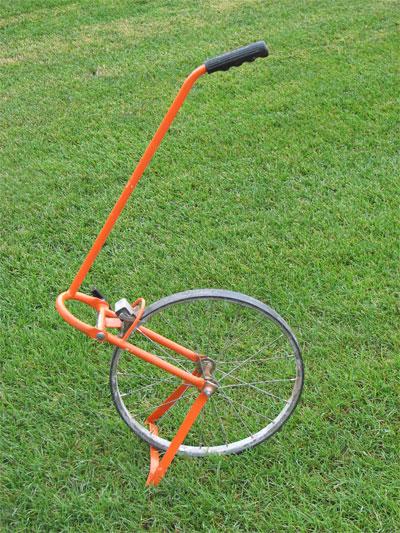
The Click Wheel
Familiar to most cross country coaches, the “Click Wheel” is similar to a small bicycle wheel but instead of an inflated tire has a thin hard rubber contact surface. Available in metric or imperial, the wheel is pushed along by someone walking or jogging behind it. With each revolution or fraction of a revolution, the distance traveled in meters or feet is clicked off in a numerical window counter. Virtually every American high school and college cross country program has used the wheel to measure its home course. Also practically every cross country coach and athlete has seen those inexplicable race results described above caused by a course that was too long or short .
Since the wheel is almost universally used, and since it is important (soon it will be essential) that courses be measured accurately, this study attempted to see just how accurate the wheel is.
Methods
Each of 101 tests of three wheels (two metric and one imperial) took place on typical surfaces found on cross country courses. Those surfaces include:
· Grass (short, medium, long, both wet and dry)
· Wood bark mulch
· Wood chips
· Dirt
· Gravel
· Sand
· Paved roads
· Track surfaces
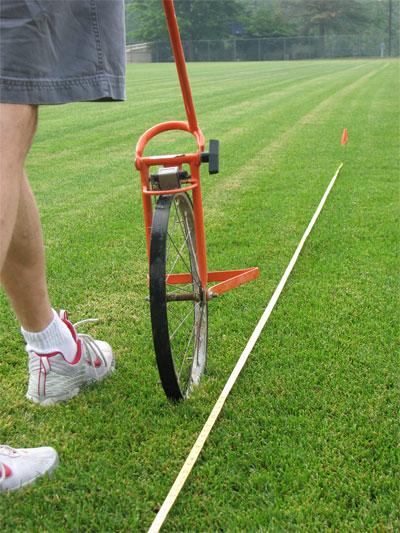
Each test was completed on a tape-measured one-hundred-meter (100m) segment of each surface by:
1. pulling out a long tape measure in a straight line and marking the zero and 100m marks with wire flags,
2. making sure the wheel counter was set to 0 and the wheel itself was set to absolute zero and not some fraction of a revolution before beginning,
3. rolling the wheel parallel to the tape the same number of inches away from the tape the entire 100m to minimize error due to weaving,

Testing the wheel against a tape measure
4. recording the results, noting if the wheel under read (UR)—its counter showed numbers lower than the actual distance traveled—or if it over read (OR )—its counter showed numbers higher than the actual distance traveled,
5. repeating the same test in the opposite direction on that surface,
6. repeating each direction again three times.
A roll up fiberglass tape typical of those used to measure field events in track was used to measure each test segment. The tape was calibrated by checking it against a laser measured 100m segment on a track at F 80 degrees plus. When considerable tension was exerted on the tape it was possible in those temperatures to stretch it 1.5” to 3” beyond the 100m mark. However, when minimal tension was exerted sufficient only to eliminate slack, the tape produced accuracy to within one quarter of an inch. Care was taken with each test to apply the same minimal tension.
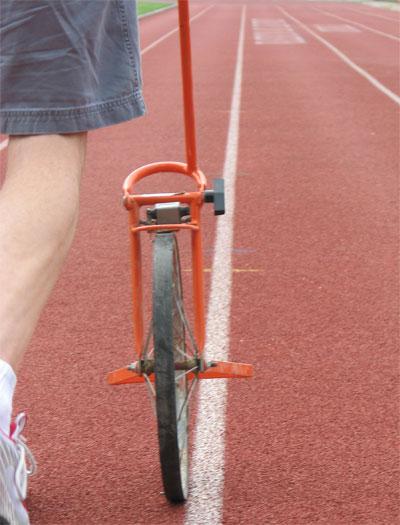
The wheel itself was calibrated by rolling it along the edge of a lane line (to minimize weaving) on the track straightaway for exactly 100m,

Calibrating the wheel
again being careful to start the wheel at absolute zero not some fraction of a revolution. Not surprisingly, the wheel had near perfect accuracy on the flat and uniform track surface in one direction. In that test as the wheel completed its last full revolution, the counter window clicked the number 100 simultaneously with arrival of the center of the wheel (axle) at the 100m finish line. But quite surprisingly in another test of the same wheel immediately following in the opposite direction on the same 100m track segment, it showed a 6” to 8” UR error (axle 6” to 8” beyond finish line). Identical results were observed in several consecutive tests in both directions on the track.
Results
In 101 tests on a variety of surfaces typically found on cross country courses the wheel showed under read (UR) errors of between 6” and 19’ (yes feet) in only 100m. The greatest UR errors occurred on sand and gravel. UR errors in the 5’-8’ range were frequently observed on thick tall grass, with the greatest error in that range found on thick wet grass. 1’ to 3’ UR errors were consistently observed on short dry grass or grass dirt combination surfaces.
Over read (OR) errors of between 6” to 2’occurred on undulating or bumpy surfaces such as lumpy field grass or on dirt roads with pot holes. The greater the lumps or holes were, the greater the observed error.
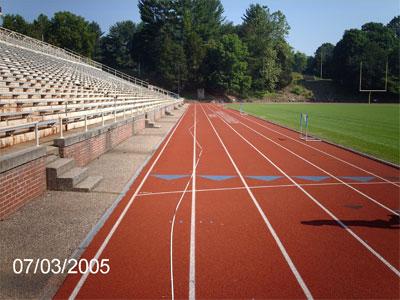
Understandably, deviating from a perfectly straight line is almost unavoidable for anyone walking with a device such as the click wheel. Tests were constructed to see what various amounts of deviation (weaving) from a perfectly straight line would yield. At every 10m on the track, marks were placed at 4” and 8” deviations from either side of a perfectly straight line (the edge of a lane line) and the tape stretched to each of those marks alternately to the right and left of the line (in a zig zag pattern)

Measuring the effect of weaving
until the 100m finish line was reached. At 4” deviations from a perfectly straight line every 10m there was an OR error at the end of 100m of nearly 4”. At 8” of deviation per 10m there was a near 9” OR error at the end of 100m.
While there was a wide variety in observed error on the different surfaces, there was remarkable consistency in repeated tests of the same surface in the same direction. The various surfaces did have measurably different influence on the accuracy of the wheel. Dry grass, for example, had only about one quarter the ability to cause error as tall wet grass.
A fascinating but puzzling experience occurred on a sunny summer afternoon while measuring thick tall grass wet from a just completed thunder storm. The usual approximately 5’ per 100m error for those conditions was observed in one direction but an almost 8’ error was consistently observed in the opposite direction. In disbelief, perhaps 10 more tests were repeated with nearly identical results. Satisfied that there was no mistake in reading the numbers or caused by inconsistent technique, attention was turned to the obvious question of why there was a 3’ differential simply because of direction. It was noted that even though the grass was recently quite wet, in the hot afternoon sun the grass was drying out fast. Also noted was the fact that the direction of this particular test was exactly toward the sun in one direction and away from it in the other, meaning that the grass being tested was dryer on one side than the other. This assumption is consistent with the frequent observation of increased UR error with increased moisture, especially on grass.
The following table illustrates the most frequently observed range of errors by the wheel each 100m on typical cross country surfaces. Projected are the cumulative effects of those errors in feet and meters at two traditional cross country race distances of 5000m (5k) and 8000m (8k), and the additional time in seconds it would take to run the added distance or that would be reduced by not running that distance, @ 5:22/mi pace or 8 seconds per 40 meters.
IF WHEEL ERROR OF PROJECTED ERROR*/ADDED/REDUCED TIME @
(per 100m) (5k) (8k)
1’ 50’ (15.24m)/3.04 80’ (24.38m)/4.87
3’ 150’ (45.72m)/9.14 240’ (73.15m)/14.63
5’ 250’ (76.20m)/15.24 400’ (121.92m)/24.38
* if surface/error remains consistent for the entire course
Conclusions
The device by which almost every cross country course in this country has been measured was found in controlled tests to be significantly inaccurate on typical surfaces. Depending on the predominant surface and its condition, course length discrepancies on wheel measured courses, through no lack of diligence on the part of the person using it could reach 100m or more. For example, on a smooth dry grass 8k course, where the wheel consistently under reads the actual distance traveled by nearly 3’ each 100m, one should not be surprised to discover that course to be actually about 73m longer than the wheel indicates. If the grass is wet when measuring, like in the morning when there is dew, a course thought to be 8k as measured by the wheel could be over 120 meters long.
Under read (UR) errors are likely caused by diminished traction (skidding) between the smooth hard rubber wheel and the surface being measured. Observations suggest that the harder, flatter and more uniform the surface measured by the wheel, such as an asphalt road or a track surface, the more accurate it will be. The softer and wetter the surface, the less accurate it tended to be. All three wheels showed almost identical UR errors on all surfaces in both directions. Determining exactly why the wheel under reads more in one direction than another would require a more sophisticated study but it is suspected that the grain or texture of a particular surface has some influence on the amount of skidding by the wheel. Moisture is almost surely an influence.
As to the reason for the differential error on the track, it can only be assumed that grain or texture of the granular track surface must have had more of an effect in causing skidding in one direction than the other. As synthetic track surfaces are often applied initially in a liquid form topped with rubber granules and smoothed with a large trowel similar to how concrete is finished, it seems reasonable that its granular texture would be affected by that application procedure and cause more wheel skidding in one direction. Why the wheel shows significantly different readings at exactly the same distance depending on direction remains an unexplained but frequently observed characteristic.
Over read (OR) errors, where the wheel measures every undulation of a lumpy or pitted surface are probably easier to explain. Obviously the shortest distance between two points is a straight line, so any horizontal or vertical curving of the line between the same two points will naturally cause it to be longer whether due to weaving (horizontal) or bumps and holes (vertical). Where deviations from a perfectly straight line as much as 8” occur every 10m, the wheel will over read an 8k course by about 18m and a 5k course by about 11m. If in addition to weaving by that amount, substantial amounts of lumps or pot holes are also encountered, another 30m OR error could easily be added making the cumulative OR error in the 40m to 50m range. As might be expected, the larger diameter imperial wheel seemed less susceptible to over read error due to lumpy or pitted surfaces than the two smaller metric wheels.
.
It would certainly also be possible while wheel measuring a course with just the right combination of surfaces, moisture, bumps, holes, and deviation, for OR error to be entirely cancelled by UR error, in which case the length of a course according to the wheel could accidentally be exactly correct. In fact it is likely that a combination of UR and OR errors will be present with any use of the wheel. However, in general it appears that the smoother and wetter the course (entirely grass for example) the more UR error the wheel will likely display making a course longer than it should be. The lumpier the course or if there is excessive weaving of the wheel the more OR error will occur making the course shorter than it should be. The total accumulation of these errors will depend on the conditions causing them.
Perhaps the most remarkable thing observed in this study about the wheel was its consistency. Though demonstrably inaccurate, frequently in the 3’ to 5’ range per 100m, the wheel displayed nearly identical error in consecutive tests on the same surface in the same direction. What this means is that even though a course could be short or long by as much as 100 meters, the wheel would show almost exactly the same erroneous reading three times in a row if done the same way, convincing a coach diligently trying to get it right that his measurements must be correct.
Recommendations
Try your own experiment with the wheel. Take it out on your track and check it at exactly 100m. It will likely be very accurate. Then take it out into the adjacent field and check it again on a tape measured 100m segment on grass. To see the most dramatic error try this on thick wet grass. Be sure to start your wheel at absolute zero (mark the spot), not some fraction of a revolution, and notice where the zero spot is when you finish. This would be especially necessary of the metric wheel where one digit on the window counter represents over three feet in distance. You will probably see results similar to this study.
So if the wheel is not the device to be measuring cross country courses, what should we be using? Large diameter wheels like the one used at Lehigh University, are less susceptible to OR errors and might be a possibility if the skidding problem can be fixed. GPS has great promise and some coaches are already using it. GPS is in fact a great way to get acceptably accurate measurements on open and flat courses. Problems with GPS arise however when there are hills and trees. Trees block the signal and currently the accuracy of most GPS systems is significantly less in the vertical (on hills) meaning that measuring a course with substantial tree cover or elevation changes will not be accurate or it will take excessive time. In a few years it is likely GPS technology will overcome these problems. When it does we will all be using it. Bicycle measurements are used by USATF for their certified road race courses and, if great care is taken, could be used on cross country courses, but tire pressure, temperature and other calibration procedures, not to mention the ability to ride consistently with minimal weaving, are potential problem areas with bicycles. Surveying instruments are amazingly accurate but measure only in straight lines, and if you have ever had to pay for a survey you know why we don’t just hire surveyors to measure cross country courses.
Currently the best device to measure courses appears to be a long tape measure, like those used in track and field, pulled out to 50 meters and carefully laid on the runners’ line (shortest route) using a 12” setback from the inside course boundary on curves (like curves on a track are measured) and carefully pulling out any slack. It is accurate, easy to use, affordable, and already in every track program’s equipment locker. Pulling a tape measure around an entire course might at first seem a daunting task but having measured over 30 courses all over the country over the last five years OCRS has developed a standardized course measurement method[3] so an 8k course, for example, can be precision measured by two people in about 4 hours. No doubt more efficient ways will evolve to get the necessary accuracy of course measurements.
Finally, if the sport of cross country is to progress to where:
· performances have universal meaning
· pacing on difficult courses is no longer guesswork
· objective comparisons of results are not only possible but commonplace
· athletes can finally know how well they ran
one essential component of that progression is certain. We will need to be using a measurement device and method which is consistent, affordable, easy to use, available, and above all accurate.